![]()
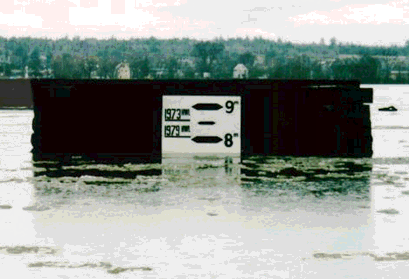
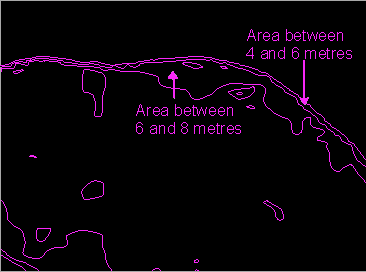
Contour lines form closed polygons which could be nested within each other. By building a topological layer for the contours, we can delineate areas within a certain elevation range. We will use the two layers to find the properties that could be affected if the water from the river rises to 8 metres. In 1973, a record-high flood in Fredericton reached a level of 8.6 metres while in 1979, the second-highest flood reached 8 metres. The following picture showing the water level markers was taken during the 1994 flood.

![]() Generate
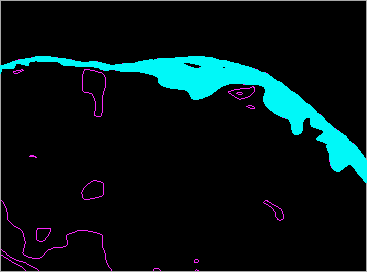
a buffer zone of areas at or lower than 8 metres.
Generate
a buffer zone of areas at or lower than 8 metres.
1. Disconnect the DB Manager since we do not have user-defined attributes for contours.
2. Display theme 90 for contours.
3. Select these two polygons covering the area at or under 8 metres.
4. Select the Utilities > Zone > Create > By Polygons ... menu item to create a zone from the selected polygons. Use a resolution of one metre and call the zone FLOOD.
![]()

